CT void analysis answers a question standard porosity inspection does not: not just how many voids exist in a casting, but where they cluster relative to the gate. This distinction changes the entire purpose of the inspection. A void count tells a quality team whether a part passes or fails. A void location map tells a mold designer why the voids formed there in the first place. The chart above illustrates the pattern behind this: void concentration typically rises with distance from the gate, since metal cools and loses fill pressure as it travels through the mold, trapping gas and shrinkage porosity disproportionately in last-fill regions.
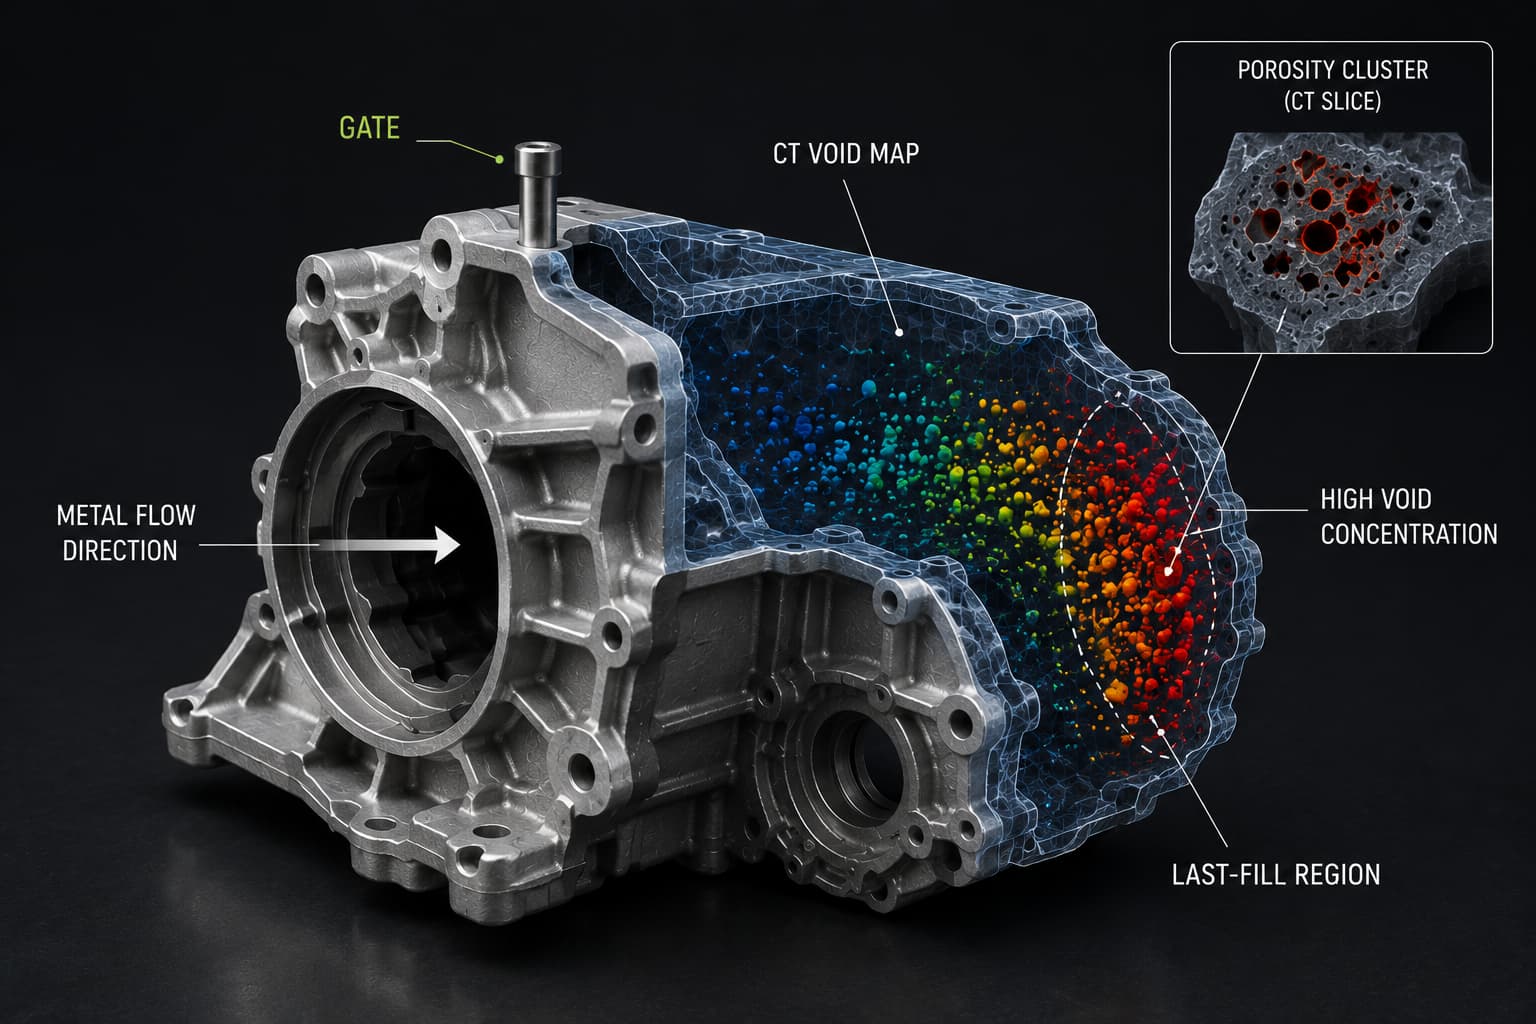
Conceptual illustration of CT void mapping on a die-cast aluminum housing, showing porosity clustering in the last-fill region farthest from the gate, used to explain CT void analysis and gating optimization.
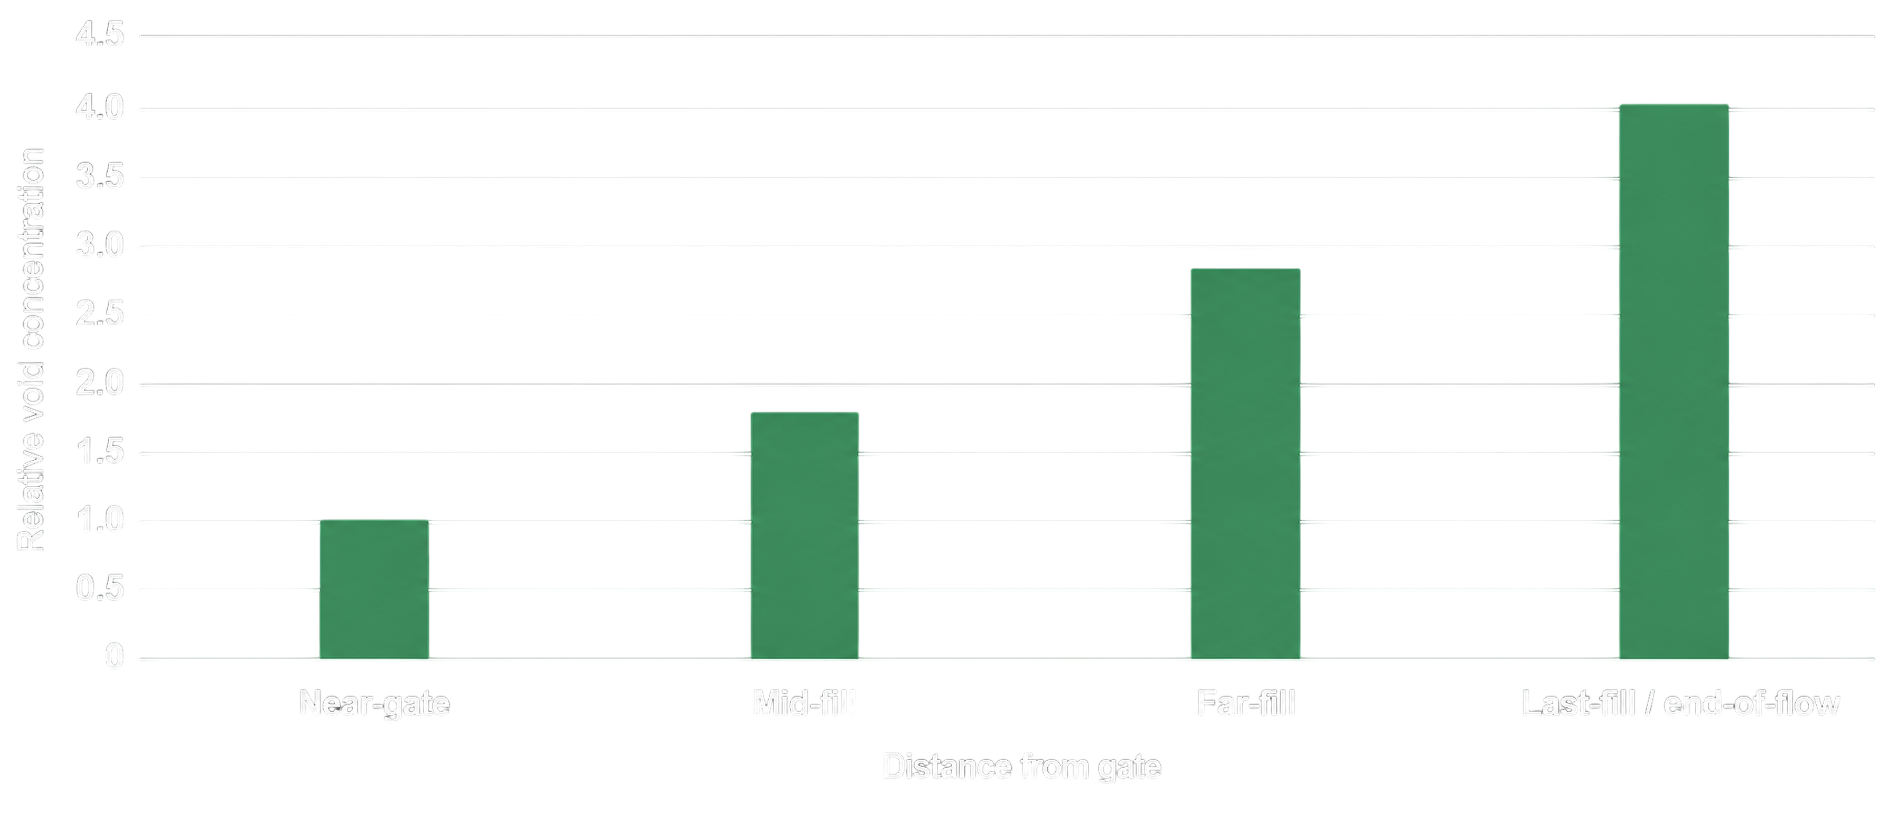
Illustrative engineering relationship, not measured data. Actual void distribution depends on gate design, alloy, and fill velocity.
From Defect Detection to Gating Optimization
Standard die casting quality inspection stops at pass or fail. Closing the loop means feeding CT void location data back into gate design, adjusting gate placement, runner geometry, or fill velocity to reduce porosity specifically in the zones where it concentrates. This reframes casting defect detection from a downstream checkpoint into an upstream design input. XRAY-LAB has documented the underlying die-casting porosity mechanism in CT analysis of aluminum die castings for automotive structural parts, and the same volumetric data used there for pass/fail decisions is what supports gating adjustments when void clustering points to a design, not a process, root cause.
Porosity analysis at this level requires resolving void size, shape, and 3D position, not just flagging that porosity exists, which is the same threshold-based approach XRAY-LAB has detailed in porosity analysis using CT scanning. Distinguishing scattered gas porosity from a connected shrinkage cavity at a specific gate distance is what turns a defect map into an actionable engineering signal.
Gating changes made from void map data should be validated against a new CT scan of the revised tooling’s first-article castings, the same qualification logic XRAY-LAB applies in CT scanning for supplier quality validation: a design change isn’t confirmed effective until it’s measured, not assumed.
XRAY-LAB performs CT void analysis on die-cast components to map void location, size, and concentration relative to gate position, giving mold designers the data needed for gating optimization rather than a simple pass/fail result.
Frequently Asked Questions
What is CT void analysis in die casting?
It is the use of industrial CT scanning to map the size, shape, and 3D location of internal voids in a casting, rather than just counting them.
How does die casting quality inspection support gating optimization?
By identifying where voids concentrate relative to the gate, quality data can be fed back into gate and runner design to reduce porosity at its source.
Why does porosity typically increase farther from the gate?
Metal loses fill pressure and cools as it travels through the mold, trapping more gas and shrinkage porosity in last-fill regions.
Can casting defect detection distinguish gas porosity from shrinkage porosity?
Yes. CT resolution sufficient to resolve void shape and clustering can differentiate scattered gas porosity from a connected shrinkage cavity.
Should gating changes be re-verified after adjustment?
Yes. First-article parts from revised tooling should be CT scanned to confirm the gating change actually reduced porosity in the targeted zone.